Observe everything you want in your business and never miss any X factors .

English | 简体中文
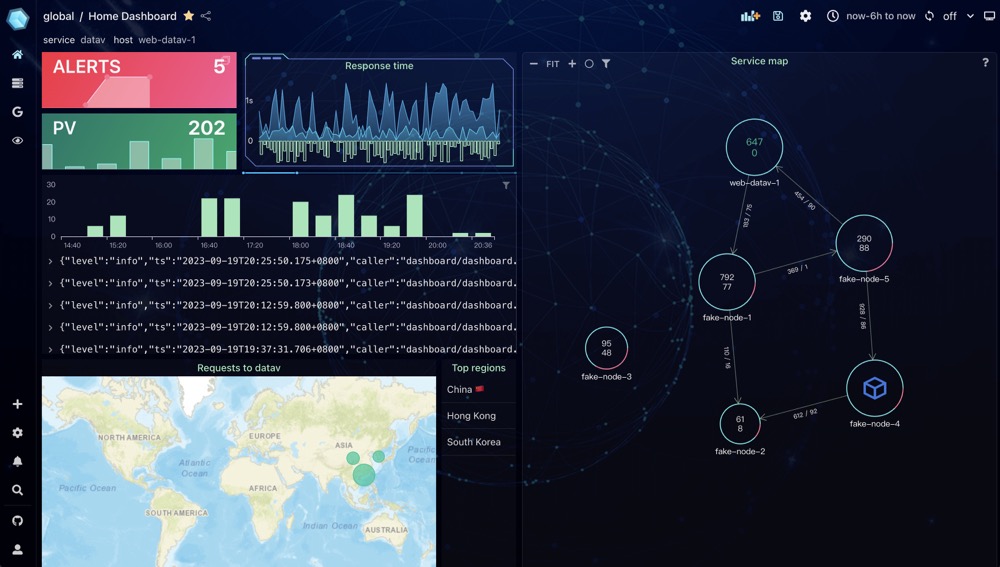
XO is short for xobserve. It is a programmable observability platform designed specifically for developers. It also serves as an alternative data visualization platform to Grafana.
XO enables users to quickly create online observability scenarios such as monitoring, logging, and tracing. If XO does not meet your specific needs, you can always file an issue, and reasonable requests will be promptly addressed.
Up to this point, we have implemented the user interface (UI) part of XO, which can be used as an alternative to Grafana. We are currently working on the observability features, which will be released in V1.0.
XO offers a wide range of features, including:
-
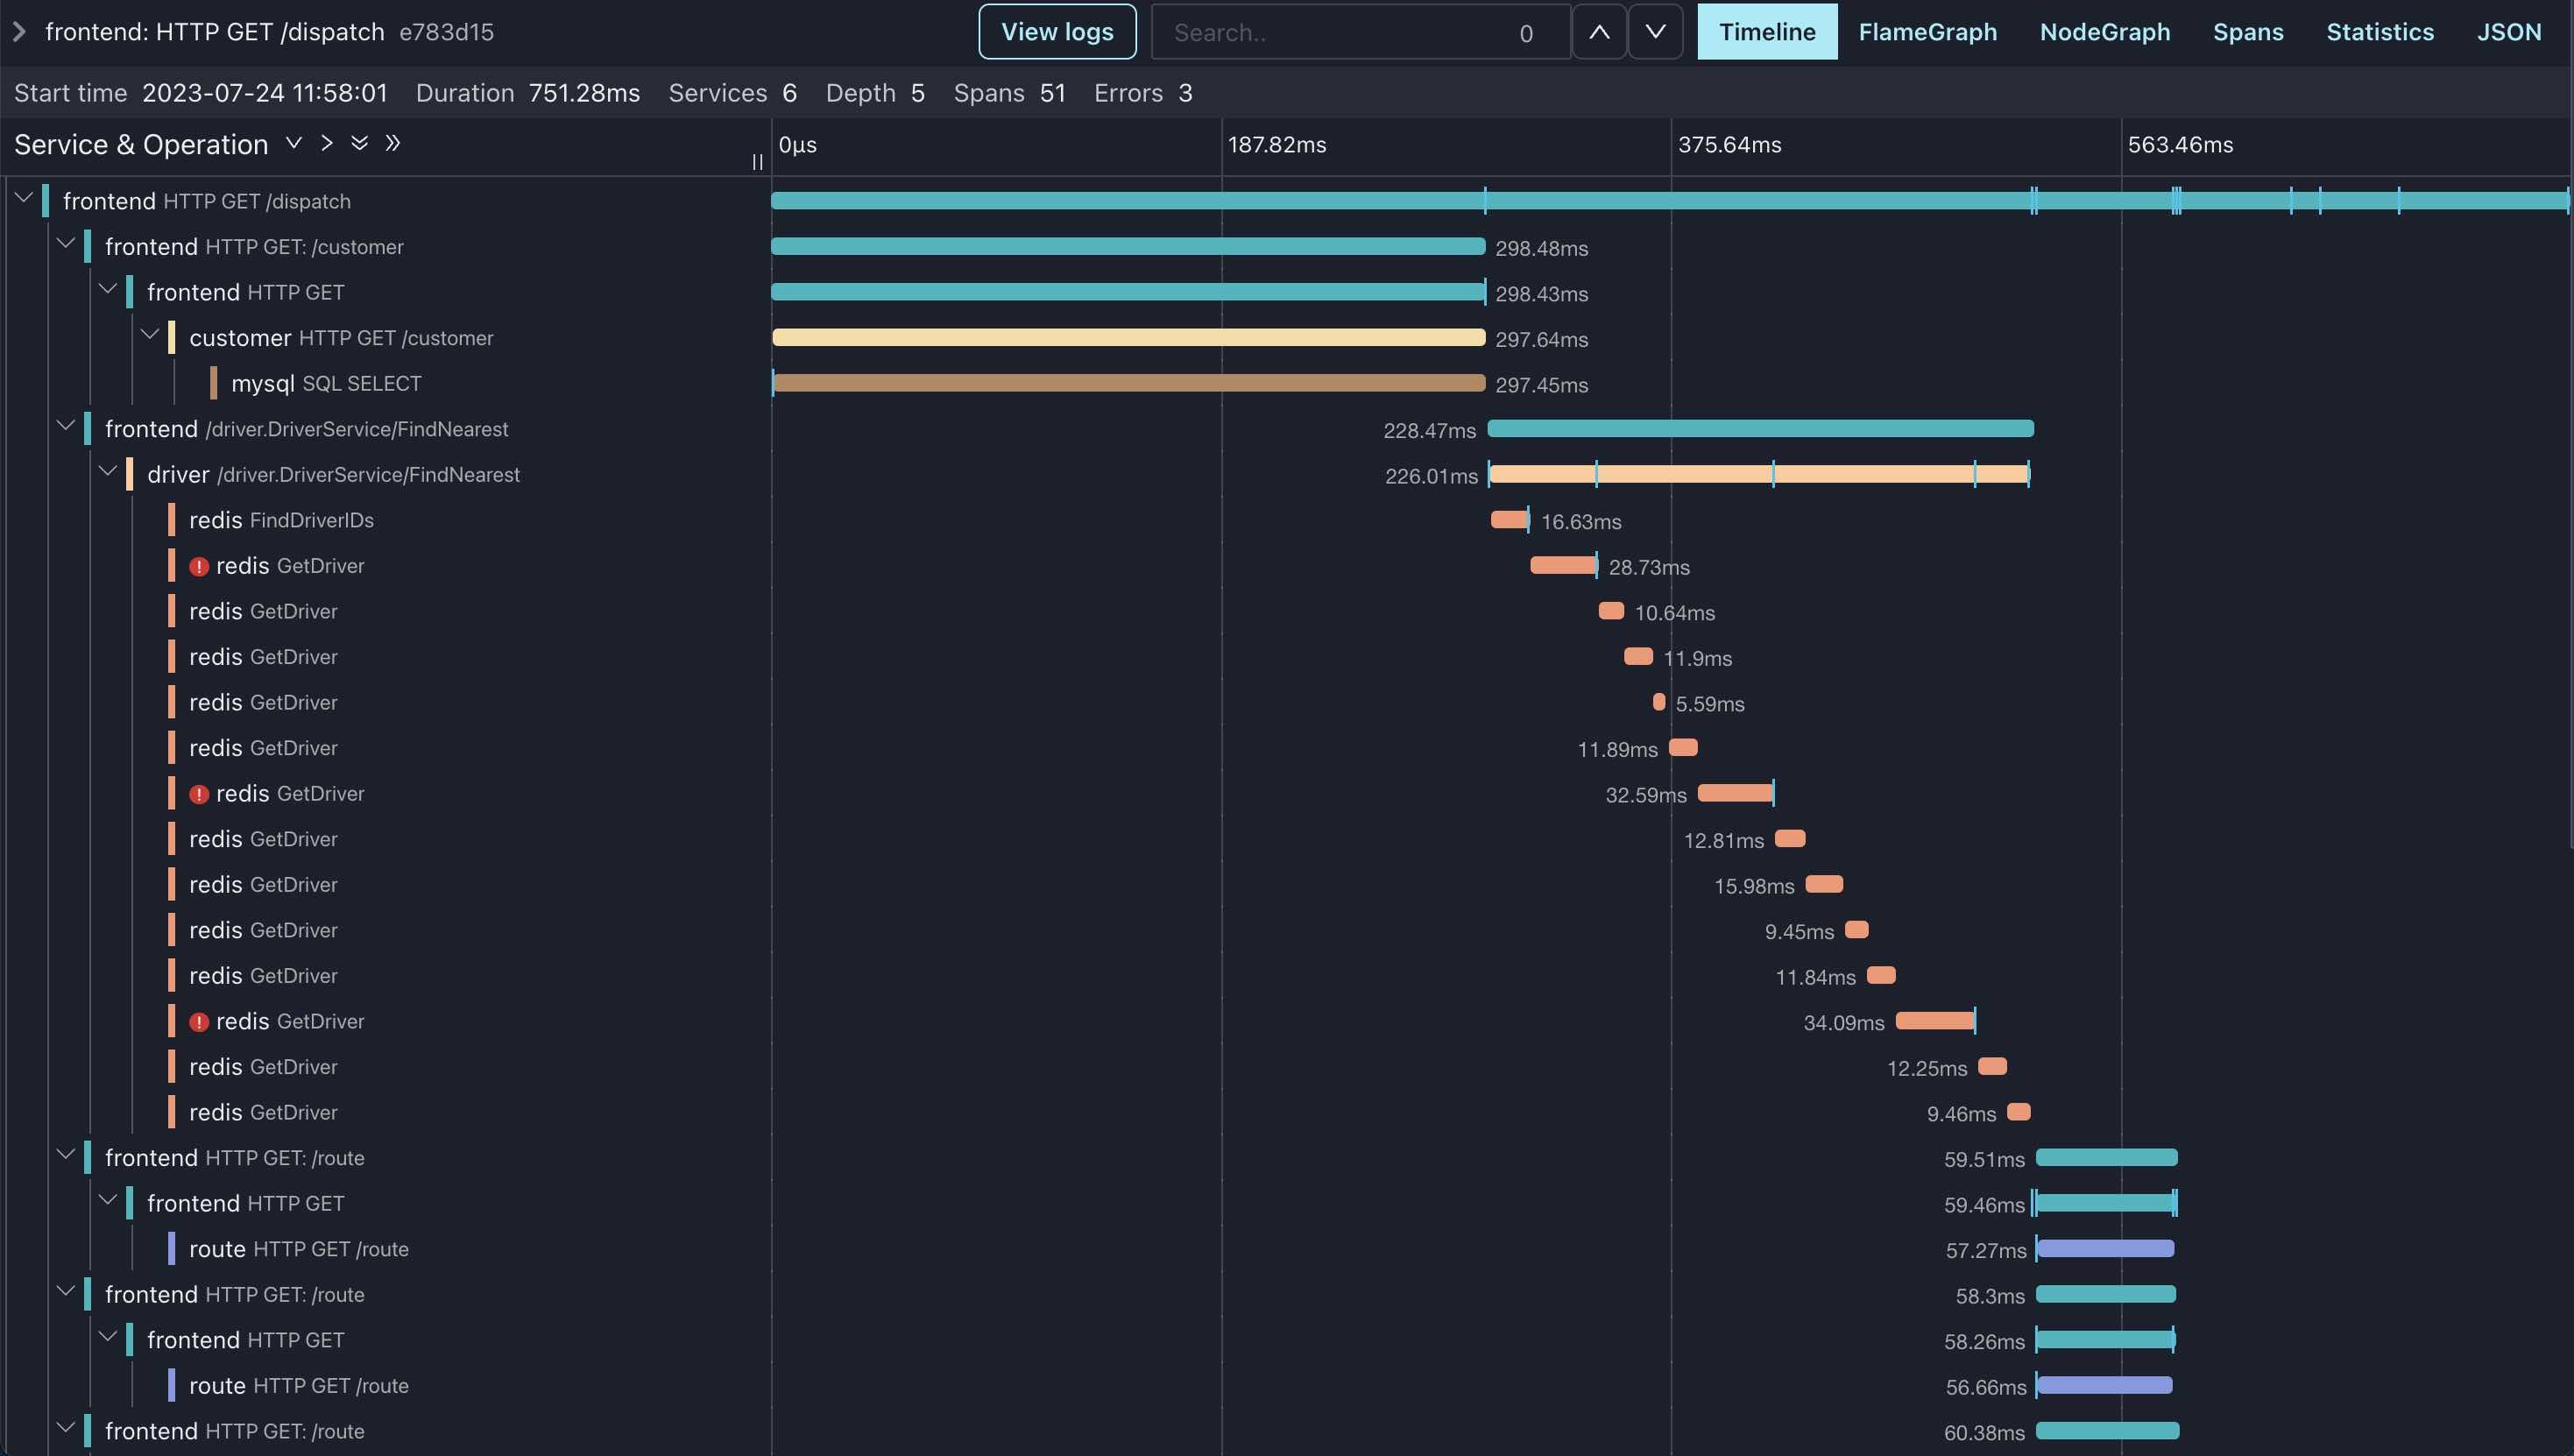
Observability: Encompasses an extensive range of observability scenarios with native support for Opentelemetry.
-
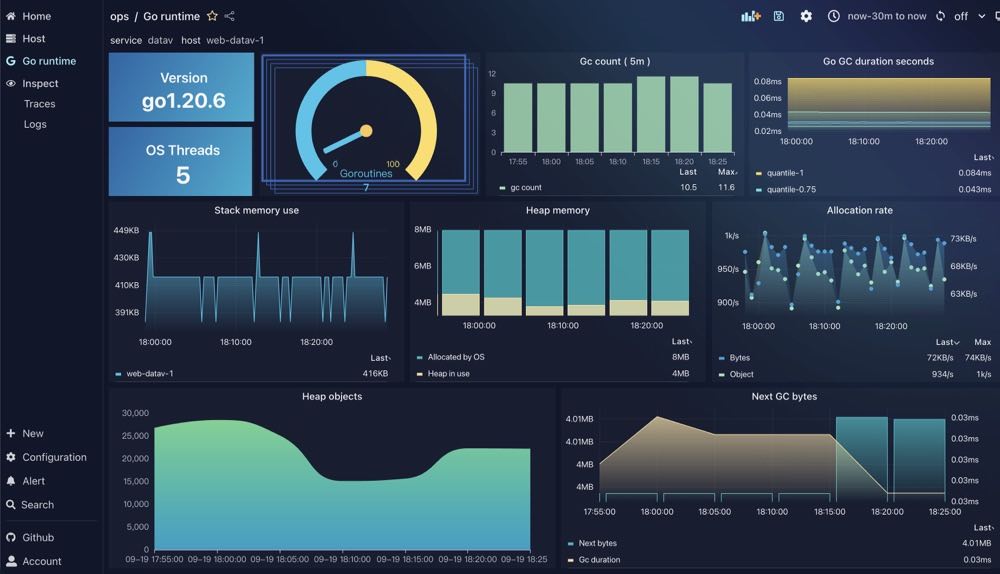
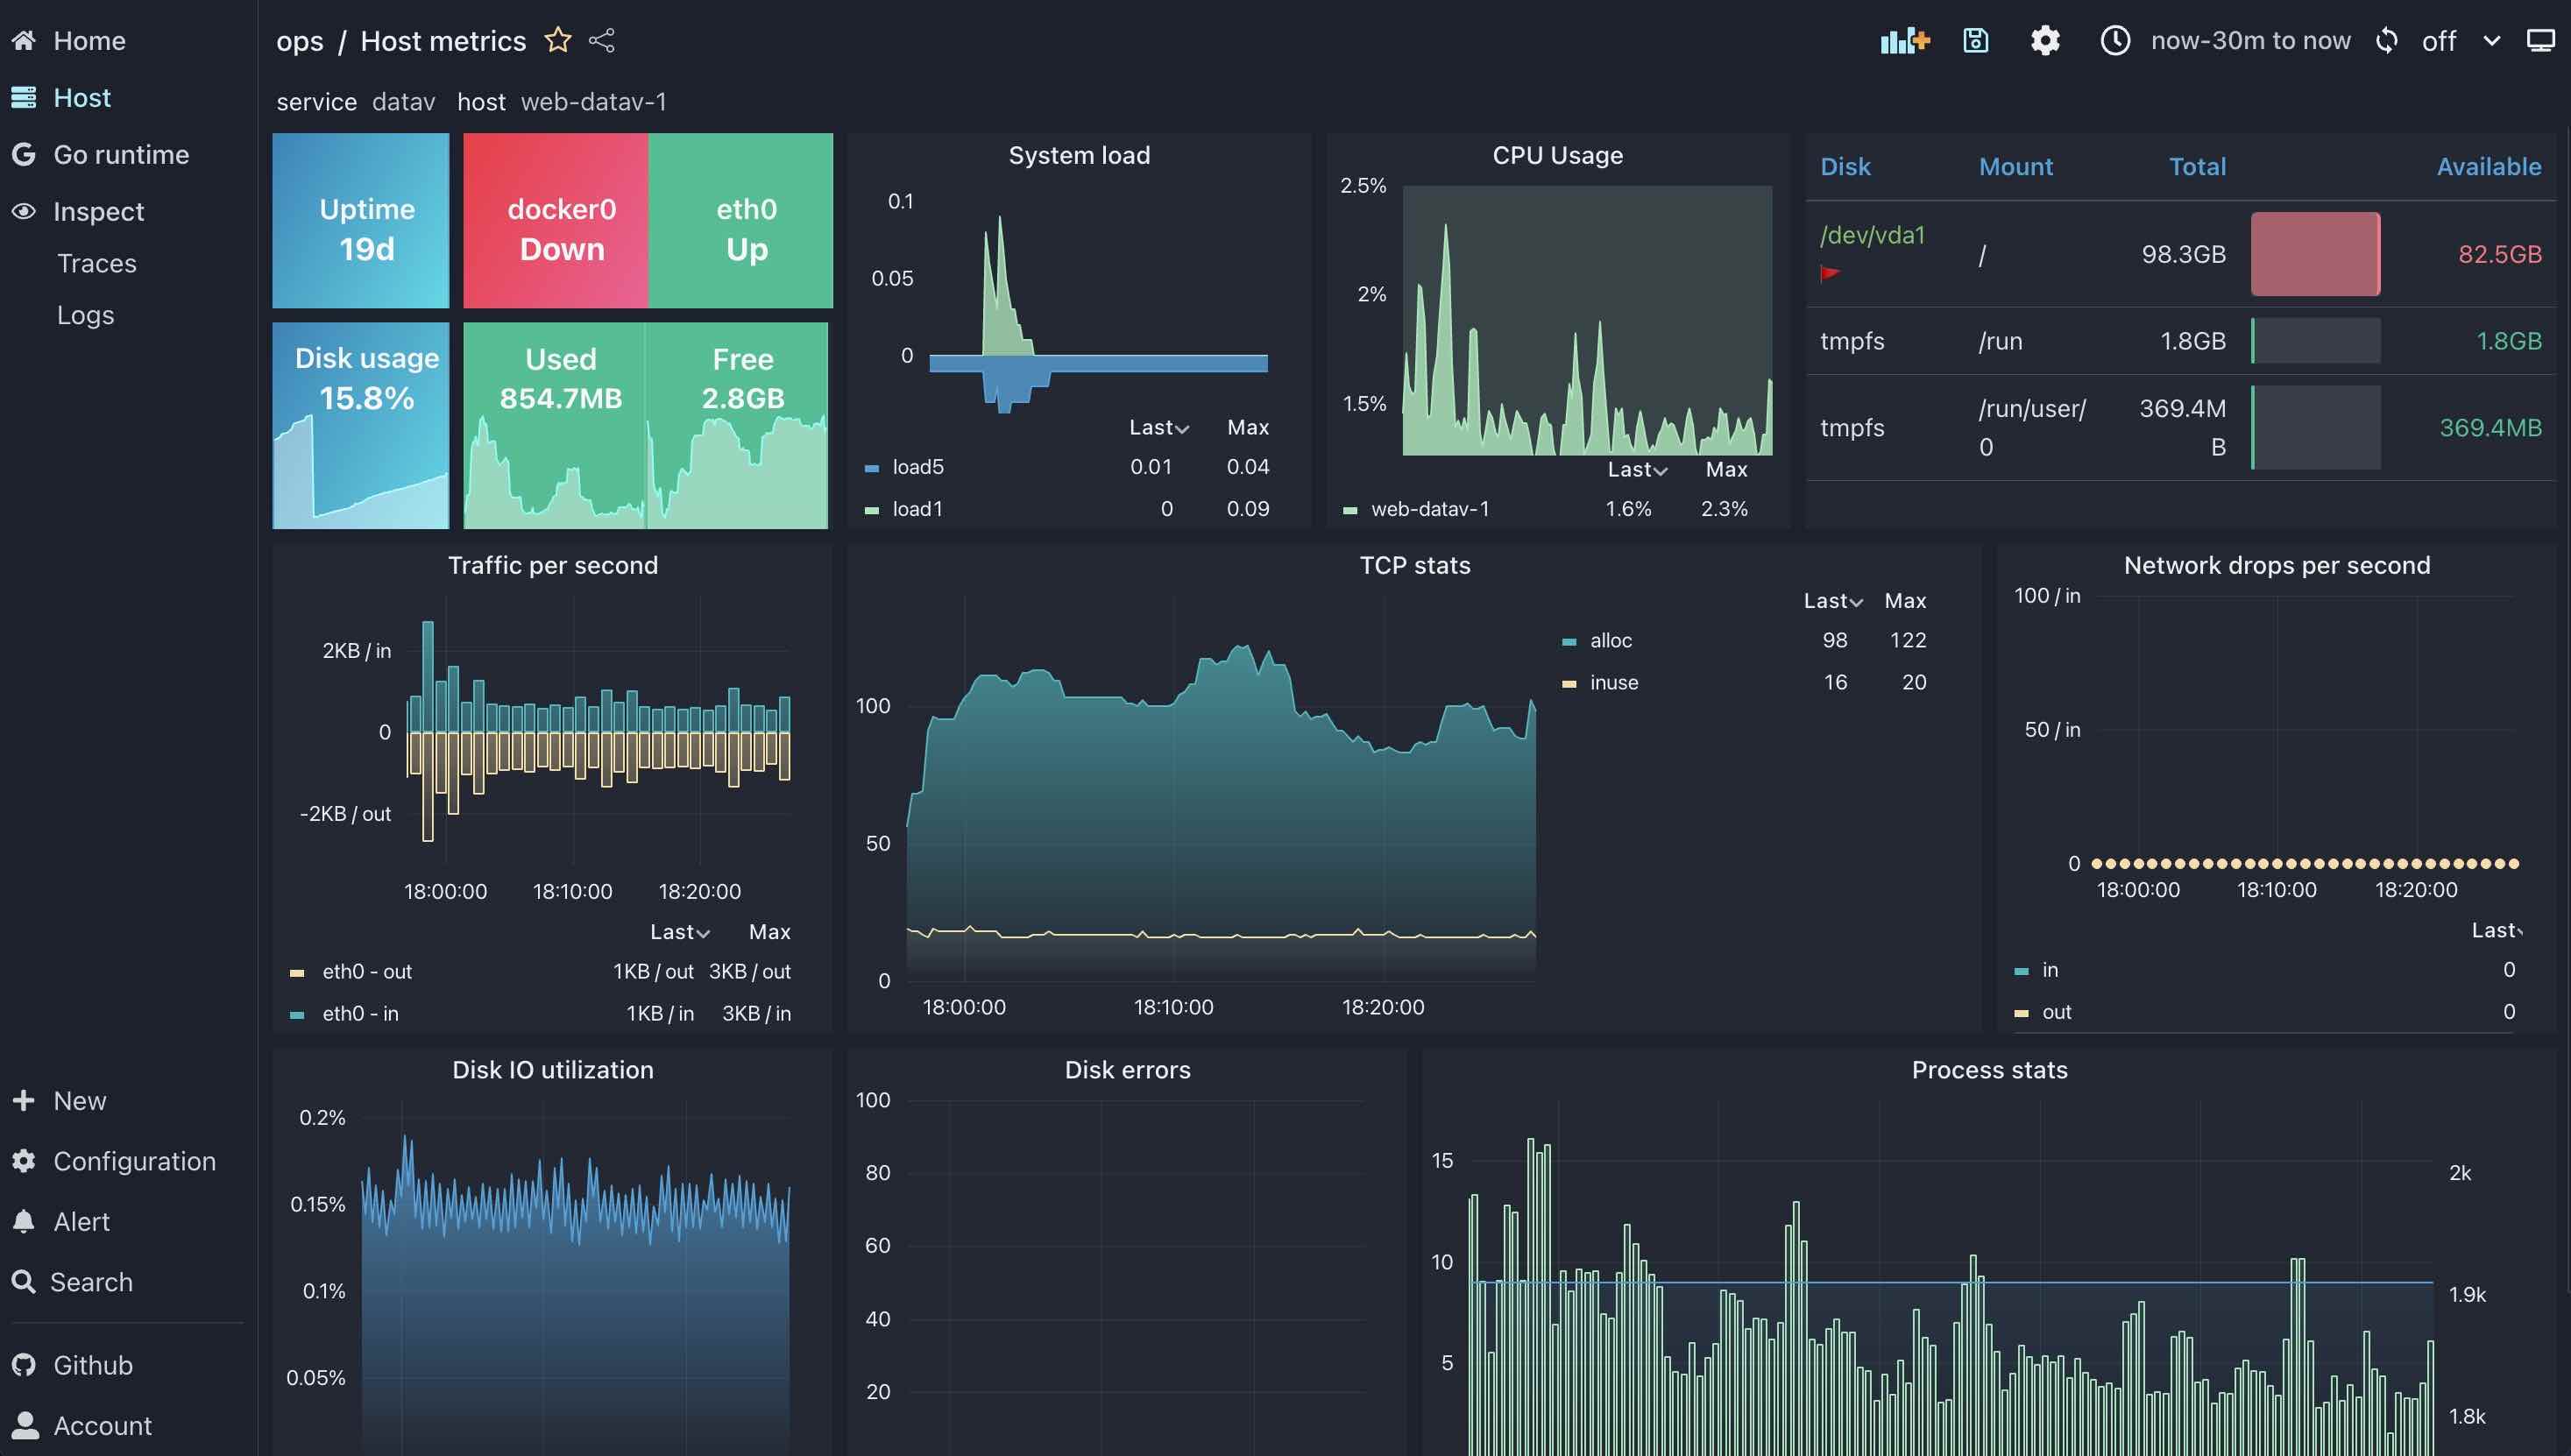
Charts and Datasources: Provides numerous chart components and data sources with rich customization options.
-
Interactivity: Offers deep and customizable interactions between charts and pages.
-
Enterprise features supported: Includes multi-tenancy, permission management, navigation menus, and global state management.
-
User experiences: Offers blazing fast performance and full customizability, ensuring a great user experience.
-
Modern UI design: Supports large data screens and is perfectly compatible with mobile devices.
-
Programmability: Empowers developers with powerful programmability and customization options. For instance, Datav agent supports using WebAssembly to develop your own plugins and data processing pipelines.
-
Community: Comes with extensive documentations, and rapid community support response.
The documentation is available at xobserve.io/docs.
You can also try online demo at play.xobserve.io.